
When time gets desperate you may need to debug into SharePoint’s OOTB JavaScript to work out a particular problem. The challenge here is that the OOTB JavaScript are minified, which makes debugging almost impossible.
This post describes three approaches you can use to overcome this. To be clear, we are talking about debugging these JavaScript using the browser’s developer tools.
1. Instruct SharePoint to use the debug version of the JavaScript
You can achieve this by modifying either the site’s web.config or masterpage. This approach therefore is only possible if you have control of the site, e.g. in a Dev or Test environments.
Note that you only need to modify either the web.config, or the masterpage, not both.
Modifying the web.config
The web.config contains an element as below:
<compilation batch="false" debug="false">
Set the debug attribute to true and SharePoint will use the debug version of its JavaScript.
Modifying the masterpage
The masterpage typically has a ScriptManager control that manages script references for the page. This control has a ScriptMode attribute, which if set to Debug will cause SharePoint to use the debug version of its JavaScript.
2. Using Pretty Print feature of your browser’s developer tools
Below is what a minified JavaScript typically looks like in the browser’s developer tools.

The file above is the OOTB init.js, which has thousands of lines of code – but is compressed down to a few lines in the minified version. There are three problems with debugging a minified file such as this:
- It is impossible to set a breakpoint on the right line of code
- Text searching, e.g. for a particular function name, is very slow
- Variable names are replaced with a, b, c, d, etc.
You can overcome the first two problems by turning on Pretty Print (as it is called in Chrome) in the browser’s developer tools. In Chrome, this is the { } icon as shown below.

Below is the same init.js with Pretty Print enabled:

You can now set breakpoints, and text search performs as you would normally expect.
You may notice that variable names are still a, b, c, d, etc. To overcome this you can open the corresponding debug version of the file on your local machine under the SharePoint root, e.g. init.debug.js, and cross-reference with this file. This is not perfect, but may be sufficient for simple debugging.
3. Using Fiddler to intercept minified JavaScript and serve debug version
Fiddler is a free tool that monitors web requests from your computer. It has a feature that allows you to intercept requests to a specified URL and serves up to your browser an alternate local file instead of the requested URL.
The steps below configure Fiddler to intercept requests for a minified JavaScript (init.js in this example), and serves up the corresponding debug version from our SharePoint root.
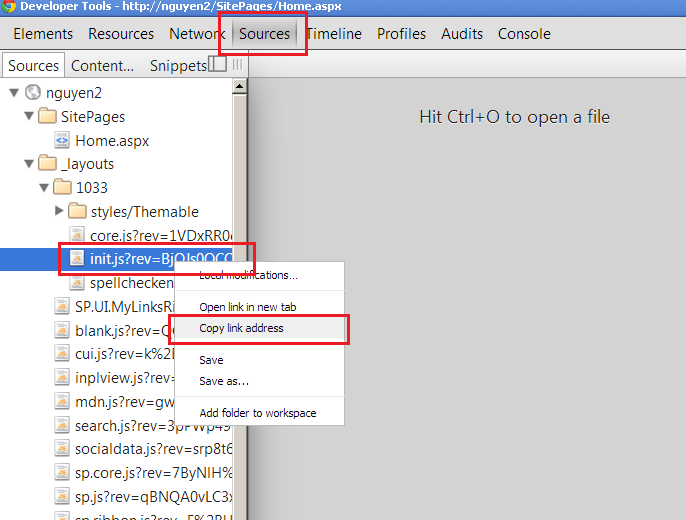
- In your browser, browse to the SharePoint page containing the script you would like to debug
- Launch your brower’s developer tools and determine the URL of the script you would like to debug. The screenshot below shows how I did this using Chrome.

- Launch Fiddler
- On the right hand side, click the AutoResponder tab
- Tick Enable automatic responses
- Tick Unmatched requests passthrough
- Click the Add Rule button
- In the Rule Editor section at the bottom of the tab, enter EXACT:[minified script URL] in the first drop down. Browse for the corresponding debug version of the script on your local machine in the second drop down.
- Click Save. The screenshot below illustrate these steps:


Now refresh the page in your browser. In your browser’s developer tools, even though the URL of the script being requested is still the minified version, the content being served to your browser should now be the debug version, as shown below.

Conclusion
The three approaches above allow you to debug OOTB JavaScript in SharePoint which are minified. Choose the approach that best suit the level of control you have of the site, and how deep you need to debug into the OOTB code.
